September 10, 2026 – 6-minute read
Space Efficiency and Office Utilization: Key Metrics, Measurement Methods, and Right-Sizing
For you, space efficiency is one of the most critical factors in open-plan offices today. Rising rent costs, hybrid work models, and increasing pressure on office space mean that traditional office layouts no longer work. At the same time, C-level executives expect clear opportunities for cost savings—without negatively impacting productivity or employee satisfaction.
This is exactly where booking data becomes crucial. Data from parking, desk, and room bookings gives you, for the first time, a realistic picture of how your spaces are actually being used. And this is exactly the insight you need to make informed decisions.

Head of Marketing
What is space efficiency?
Definition and basics
Space efficiency describes how effectively you actually use your available office space. Essentially, it refers to the ratio between the total floor area of the building and the portion that is available for actual work.
To do this, you'll work with three main types of areas:
Gross Floor Area (GFA):
The GFA includes all floor areas of your building—including walls, partitions, and structural elements. It is measured across all floors and represents the total size of your office building.
Net floor area (NFA):
The NFA is the actual usable area within the gross floor area—that is, the total area minus walls, columns, and non-accessible areas.
Usable floor area (UFA):
The UFA is the portion of the gross floor area (GFA) designated for a specific function: offices, meeting rooms, common areas, or storage spaces. It is the space you actually use in your day-to-day work.
The higher the proportion of net floor area (NFA) to gross floor area (GFA), the more efficiently your office building is designed.
Why Space Efficiency Needs to Be Rethought Today
The biggest challenge today is no longer providing enough space—but making the most of the space we have.
Hybrid work has fundamentally changed the way we use office space. Employees no longer come into the office every day, teams coordinate their work more flexibly, and occupancy rates fluctuate significantly throughout the week. This creates an apparent contradiction: while part of your space stands empty, bottlenecks arise elsewhere.
You’re probably familiar with these common scenarios from your daily life: Some days, entire areas go unused, while on others, it’s hard to find a single open workspace. Meeting rooms are either constantly empty or suddenly fully booked. The same is true for other resources, such as parking spaces—they’re either empty or there aren’t enough of them.
Without data, all you're left with is a hunch. And that's exactly the problem: space efficiency can't be guessed—it has to be measurable.
How Booking Data Improves Your Space Efficiency
Booking data gives you exactly the transparency you've been missing. You can see not only what's planned, but also what's actually happening.
A major advantage is that you can visualize actual usage. Instead of relying on assumptions, you can see exactly how many workstations are actually in use, when meeting rooms are fully booked, and how parking lot usage is trending. By using sensors, you can further validate this data and gain an even more accurate picture of actual usage—regardless of whether bookings are actually honored. That alone improves the quality of your decisions.
It becomes even more valuable when you start to recognize patterns. Individual bookings don’t tell you much on their own—but recurring usage patterns reveal how your office really operates. You’ll see which days have the highest occupancy, which areas are in particularly high demand, and where there is consistently unused capacity.
Building on this, you can actively manage your office: you can reallocate space, balance usage, and proactively avoid bottlenecks. Instead of merely reacting to problems, you can proactively shape how the space is used.
The greatest impact comes from combining different data sources. Desk bookings show you when coworkers are in the office. Room bookings give you insight into collaboration and meeting patterns. Parking spot bookings reveal who is actually on-site. Only this combination—supplemented by sensor data—provides a complete and reliable picture.
What this means for you is that you don't just understand the workload—you understand the behavior behind it.
Occupancy, Utilization, and Space Efficiency: What's the Difference?
The terms "occupancy," "utilization," and "space efficiency" are often used interchangeably. However, they describe different aspects of office use:
Occupancy shows how many people or resources are present or in use at a given time. For example, it answers the question of how many of the available workstations are occupied on Tuesday at 10 a.m.
Utilization refers to how regularly and for how long a space is actually used within a defined time period. A meeting room may be occupied at 10 a.m., but still have a low daily utilization rate if it remains empty during the rest of the workday.
Space efficiency describes how effectively the available building space is allocated among workstations, meeting rooms, common areas, and other functions.
To make sound decisions, all three perspectives must be considered together. A snapshot of occupancy is not enough to determine whether office space is permanently oversized or undersized.
How can actual office utilization be measured?
To measure actual office utilization, you need a clear data set and a sufficiently long observation period. Individual days or booking figures alone do not provide a reliable picture.
Follow these six steps when taking the measurement:
1. Track capacity
Document how many workstations, meeting rooms, parking spaces, and other resources are available at each location.
2. Select a representative time period
Analyze several typical workweeks. Vacation periods, holidays, company events, and other exceptional circumstances should be considered separately.
3. Consolidate relevant data sources
Booking data reflects planned usage. Sensor, check-in, or access data helps identify actual usage.
4. Compare Reservations with Actual Usage
A reservation does not automatically mean that a workstation or room was actually used. By comparing these two types of data, you can identify no-shows and resources that are permanently reserved but not used.
5. Break down by time and space type
Analyze the data by day of the week, time of day, building, floor, team, and resource type. An average across the entire site can mask local bottlenecks.
6. Analyze Average and Peak Values
Don't just look at the average utilization rate. It's also crucial to consider how often and to what extent the capacity limit is reached on particularly busy days.
Key Metrics for Space Efficiency and Office Utilization
To make well-informed decisions about office space, you should combine several metrics. A single metric cannot fully reflect the actual usage of a hybrid office.
Occupancy Rate Shows what percentage of available capacity is occupied at a given time.
Number of people present ÷ available capacity × 100
Shows how long a workstation or room was actually used within its available time.
Actual useful life ÷ remaining useful life × 100
Peak Occupancy
Shows the highest occupancy measured at any one time during the period under review.
Highest concurrent occupancy ÷ available capacity × 100
Peak Frequency
Shows how often an area reaches or exceeds a specified capacity limit. This helps determine whether a bottleneck occurs regularly or only occasionally.
No-Show Rate Shows what percentage of booked resources were not actually used.
Resources reserved but not used ÷ total reservations × 100
Meeting Room Utilization: Compares the actual duration of meeting room use with the total number of available room hours.
Actual room hours used ÷ available room hours × 100
Head-to-Desk Ratio
Describes the ratio between the number of employees and the number of available workstations.
Number of employees ÷ Number of workstations
Space per Employee
Shows the average amount of usable office space provided per employee.
Usable office space ÷ number of employees
Only by combining these metrics can we determine whether a space is chronically underutilized, whether bottlenecks occur only on certain days, or whether the available types of space do not match actual needs.
Calculating space efficiency: Two key formulas
Space per employee
Usable office space (sq m) ÷ Number of employees = Space per employee
This metric shows you how much space you provide per person on average. It serves as the basis for realistically planning right-sizing strategies and sharing models.
Space utilization factor
Net floor area (NFA) ÷ Gross floor area (GFA) = Space efficiency factor
The space efficiency factor indicates how much of your total building area is actually usable. The target value is a factor of approximately 0.75—which means that about 75% of the gross floor area is available as usable space.
However, these metrics initially provide only a static picture. It is only when combined with real usage data—such as that from booking systems and supplemented by sensor data—that a reliable foundation for informed decisions is established.
Why Peak Days Are Crucial in Land-Use Planning
Weekly averages can paint a misleading picture. An office may have low utilization when viewed over the course of the entire week, yet reach its capacity limit on individual days.
Therefore, also analyze the following:
the average daily occupancy,
the highest occupancy rate per weekday,
the times with the highest demand,
the frequency of peak days,
the utilization of individual land-use types,
as well as the differences between teams, floors, and locations.
A one-time peak should not automatically determine the entire space planning strategy. However, if high occupancy occurs regularly, it must be taken into account when determining the number of workstations, the layout of the space, and potential space reductions.
It is particularly important to consider different resources separately. A location may have sufficient total space, even though there is a shortage of workstations and meeting rooms remain permanently empty. In this case, what may be needed is not more space, but a better distribution of the existing types of space.
Use Case: Space Efficiency with an Integrated Booking Platform
In practice, it quickly becomes clear that isolated solutions aren’t enough. If you look at desk, room, and parking data separately, you’re missing the crucial connection. That’s exactly why more and more companies are turning to integrated platforms.
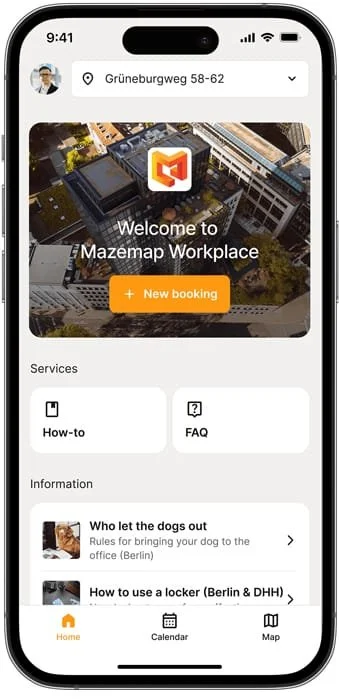
With MazeMap Workplace, you can consolidate all relevant transactions into a single system and gain a centralized, consistent database to support your decision-making.
If you want to dive deeper, you can check out the individual solutions here:
A typical real-world example illustrates just how significant the impact can be: A company with multiple locations wanted to reduce its space costs but lacked a reliable data foundation. It was only through the analysis of booking data—supplemented by actual usage data—that it became clear that actual utilization was significantly below expectations, while at the same time there were occasional bottlenecks.
Through targeted adjustments, we were able to reduce the number of workstations, optimize the mix of meeting rooms, and make parking arrangements more flexible. The result: significant cost savings while improving availability for employees.
In this context, space efficiency does not mean making sacrifices, but rather targeted and data-driven management.
Is your office ready for a space consolidation?
A low average occupancy rate indicates potential for cost savings. However, this alone is not a sufficient reason to reduce office space.
Before making a decision on consolidation, check the following:
Is data available for several representative work weeks?
Were the bookings compared with actual usage?
Are the peak occupancy and peak frequency known?
Were workspaces, meeting rooms, and common areas analyzed separately?
Are differences between teams and locations taken into account?
Have future growth and potential changes to attendance policies been taken into account?
Will there still be sufficient capacity available even on days when there are large crowds?
Can the planned change be tested on one floor or in one section first?
For realistic right-sizing, future capacity should not be based on an average office day. The starting point is the regularly occurring peak occupancy, supplemented by an appropriate buffer for growth, special events, and unforeseen fluctuations in demand.
A pilot project can provide additional certainty. If, for example, a floor is temporarily closed, it is possible to observe whether the remaining workspaces and rooms are sufficient even on busier days. This allows companies to test their assumptions before making long-term decisions regarding leases, renovations, or locations.
Data-driven right-sizing, therefore, does not mean reducing floor space as much as possible. The goal is to achieve an office size and layout that reduces costs while ensuring a reliable workplace experience.
What to Look for in a Booking Solution
To truly take advantage of these benefits, you need the right foundation. Not every system provides the data you need to do so.
Above all, it is essential to have a central platform where all bookings are consolidated. This is the only way to identify patterns and gain meaningful insights. Usability is just as important: if a tool isn’t used consistently in day-to-day operations, it won’t generate reliable data—and thus won’t provide a solid basis for decision-making.
The quality of analytics also plays a key role. You don’t need simple transaction lists; you need clear analyses that specifically show you where action is needed. This includes capacity utilization analyses, trends, and easy-to-understand reports for management.
For your IT department, issues such as MS365 integration, data security, and maintainability are also critical. If these requirements aren’t met, the project will quickly be derailed internally.
Ultimately, the solution should provide you with the best possible support in your role: you need to make decisions, minimize risks, and win over various stakeholders. To do that, you need one thing above all else—clear, transparent, and reliable data.
Conclusion: In hybrid work models where resources are scarce, a workspace booking system promotes efficiency and satisfaction
Space efficiency is not a static goal, but an ongoing process. Without data, it remains a guessing game—with the right data, it can be managed effectively.
The combination of parking, desk, and room booking gives you exactly the transparency you need to make informed decisions. When supplemented with real-time usage data, this provides a complete picture of your space utilization.
This way, you can reduce costs, use your space more efficiently, and ensure that your employees can work productively.
Frequently asked questions
-
The space efficiency ratio describes the relationship between a building’s usable floor area (UFA) and its gross floor area (GFA). The target value is a ratio of 0.75, meaning 75% of the total area is usable floor area.
-
The two most important metrics are the space utilization ratio (office space ÷ number of employees) and the space efficiency factor (net floor area ÷ gross floor area). Booking Data supplements these static metrics with actual usage data.
-
Space efficiency describes how effectively you use your office space. The goal is to minimize unused space while creating optimal working conditions for your employees.
-
Because they show you how the space is actually being used. Without this data, your decisions are based on assumptions. With this data, you can optimize your space in a targeted way.
-
That depends largely on your actual usage. Many companies today operate with desk-sharing ratios between 0.6 and 0.8—based on actual usage data.
-
Parking spaces are often an underestimated factor. They incur high costs while also providing valuable insights into actual office attendance.
-
Actual space utilization is measured by comparing available capacity with actual usage over a representative period. A combination of booking data and sensor, check-in, or access data is particularly reliable.
-
Occupancy shows how many people or resources are present or in use at a given time. Utilization measures how frequently and for how long a space is actually used within a defined time period.
-
Particularly relevant metrics include average occupancy, peak occupancy, peak frequency, no-show rate, meeting room occupancy, head-to-desk ratio, and space per person present. These metrics should be analyzed both collectively and separately by space type, day of the week, and location.
-
Consolidation makes sense when representative usage data show consistently low utilization while still maintaining sufficient capacity for peak days, growth, and varying work demands. It is advisable to conduct a limited pilot project before making a final decision.
Latest Posts

Workplace Management in the Hybrid Office: What You Really Need
Workplace management is no longer a niche topic. For companies with hybrid work models, it has become a core operational task—and, at the same time, one of the most complex.

Digital parking space management: How to finally make efficient use of unused space
For many employees, finding a parking space in the morning is a daily source of stress—even though there is often unused space available. The problem is usually not a lack of parking spaces.

Desk Sharing in the Office: Why It Often Fails—and How to Make It Work
Desk sharing —that is, the flexible sharing of workspaces in the office—has become established in German companies as a response to hybrid work models.
Are you
curious?
Contact us today using the form. We’ll get back to you shortly.
Or book a demo appointment directly :
Free & no obligation

Tailored specifically to your situation, rather than a standard demo
Book a no-obligation demo today!

Lisa Pfützner
Workplace Strategist

Give us a call
+49 69-566086786